
Daily Stock Update: An Evening Portfolio Briefing
Background
I built the daily news sender in early 2026 and had been using it for a couple of months before starting this. The experience of getting a structured briefing in my inbox each morning, instead of piecing information together from wherever the algorithm sent me, made a clear impression on what was worth automating next.
I invest in a small number of US stocks, and by early March the market was increasingly volatile. The tariff announcements that followed through April raised the stakes of missing a day's sentiment noticeably. Between a busy placement and everything else, there was not much time to monitor markets actively during the day. The idea was a structured evening summary delivered automatically: current prices, 30-day performance, and AI-generated sentiment context for anything that had moved.
The news sender had shown the pattern was workable. I started by copying several of its nodes across and progressively rebuilt the workflow to be bespoke for what a portfolio briefing actually needs, which is different from a news digest in a few important ways.
How It Works
The starting point is a Google Sheet. Each row represents a holding, with columns for the company name, ticker, share quantity, and purchase price, along with two flags: "Currently Holding" and "Want Report." The workflow reads only rows where "Want Report" is set to "Yes."
From there, a loop processes each ticker in turn. For every stock, it makes two calls to the Alpha Vantage API: one to the GLOBAL_QUOTE endpoint for the current price and 24-hour change, and one to TIME_SERIES_DAILY for the last 100 days of closing prices, from which the price closest to 30 days ago is extracted. The two calls are separated by deliberate waits. Alpha Vantage's free tier enforces five requests per minute, and I found early on that moving to the next ticker too quickly caused the workflow to progress before a successful response had come back. The wait durations are tuned to be reliably long enough without adding unnecessary time to the overall run.
Once all tickers are processed, a JavaScript code node calculates the metrics for each holding: holdings value (current price multiplied by share quantity), total gain or loss against the purchase price, 24-hour percentage change, and 30-day percentage change. These are written back to the sheet before the data is aggregated and passed to the report writer.
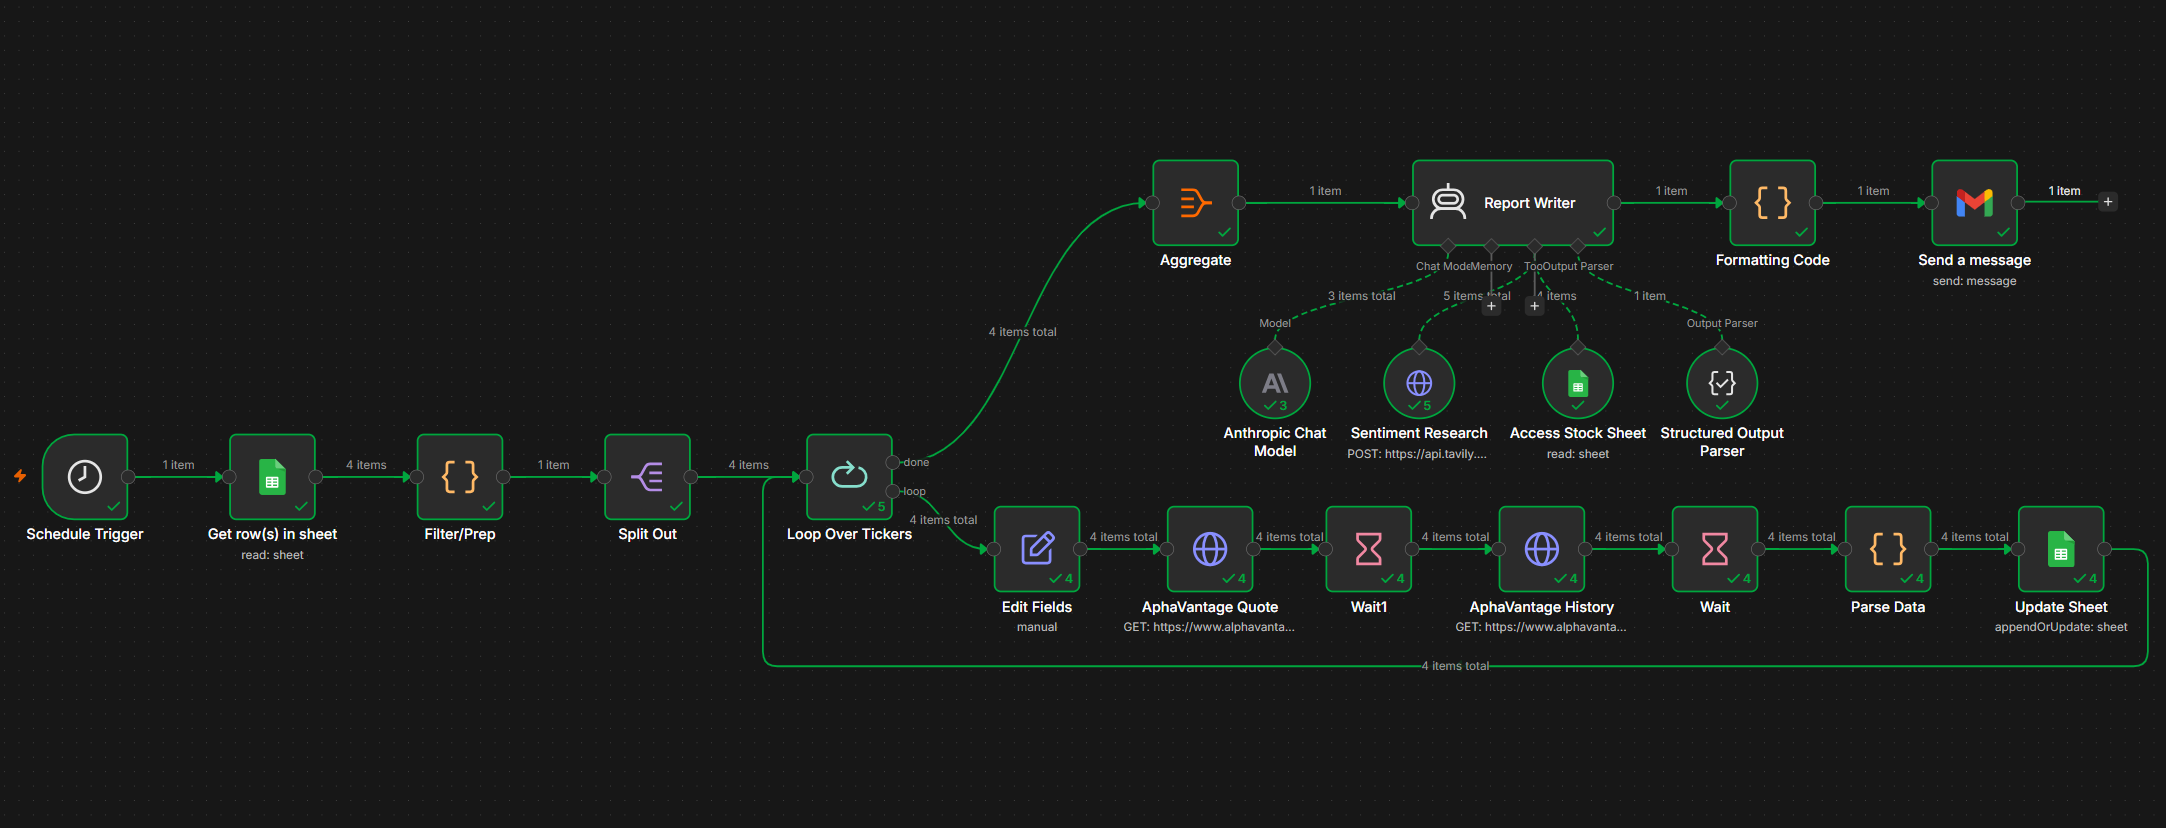 The n8n workflow canvas
The report writer is a Claude Sonnet agent with two tools: a Tavily web search for current news per stock, and read access to the Google Sheet for the personal position context. The agent decides how much sentiment research to run based on what the data shows. If a holding has moved more than 1% or there is clearly relevant news, it researches and writes commentary. If nothing significant has happened, it reports the numbers only. The agent's output is enforced as a structured JSON object: a subject line, an introduction, per-stock data and commentary fields, and a market sentiment summary. A separate JavaScript node then assembles the HTML deterministically from that data, producing a consistent layout and colour-coded formatting on every run regardless of how the agent phrases its analysis. The email is sent at 21:30.
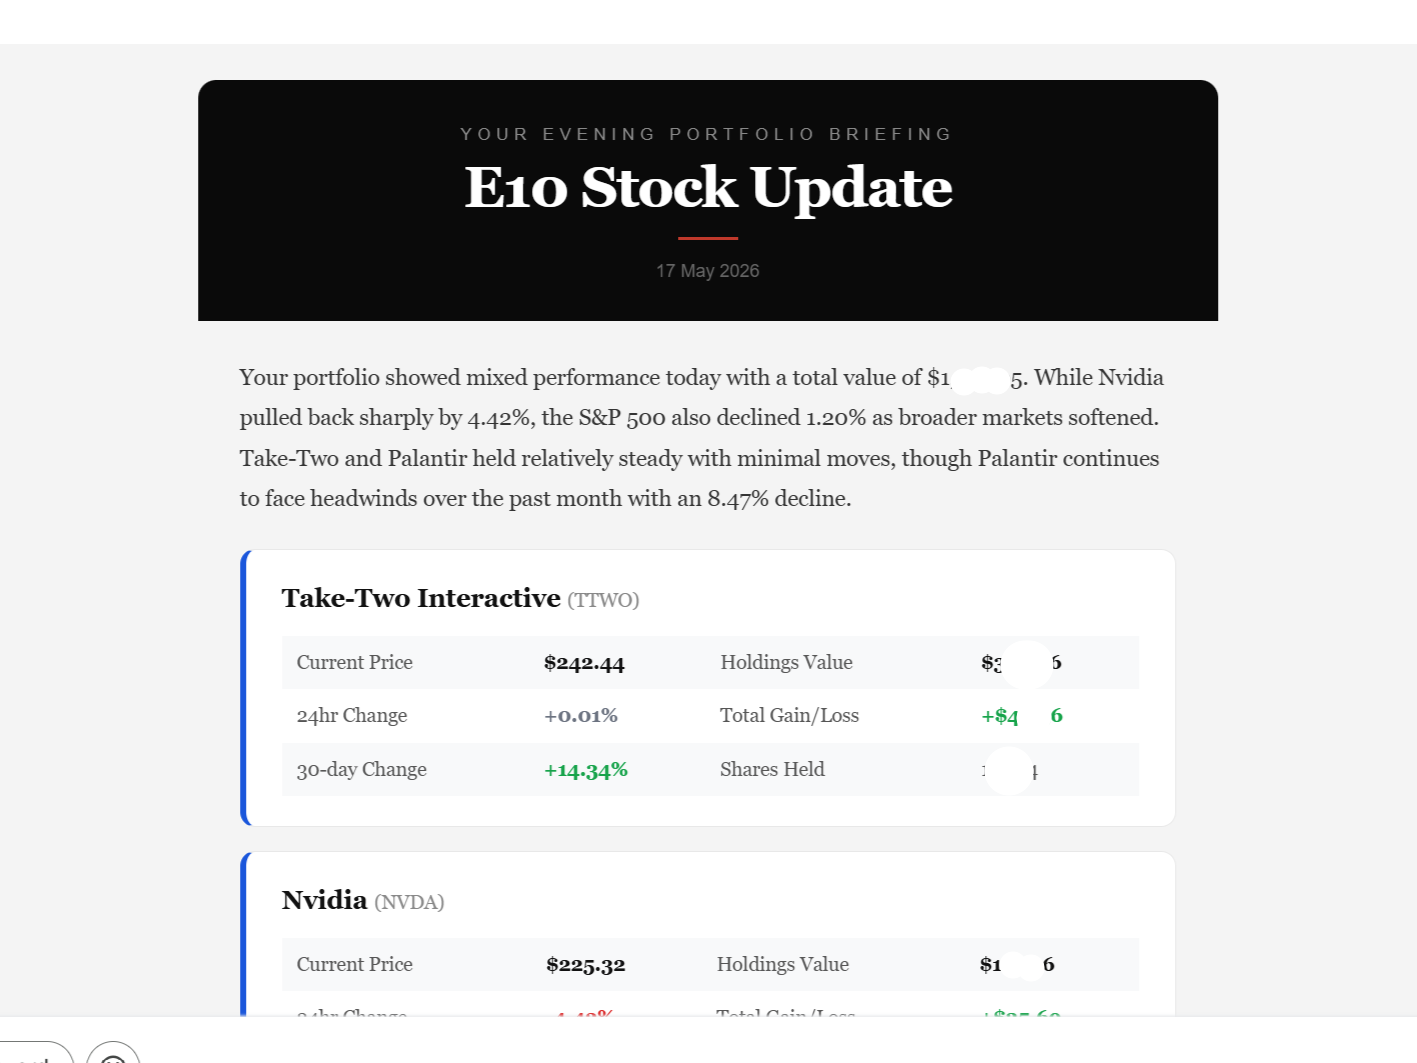 The evening email header
Getting the Detail Right
The most significant iteration was in the prompt. The news sender had given me a sense of what too much analysis looks like: a briefing padded with commentary on a flat day is less useful than one that says clearly that nothing happened. The core design decision for the portfolio report was building that threshold directly into the agent's instructions, so sentiment and commentary only appear when they genuinely add something.
Blending quantitative data with Tavily's sentiment results needed careful prompt engineering. The agent has to decide which findings from a news search are relevant to a specific position, relate them to the portfolio context from the sheet, and present them in a way that adds something beyond what the numbers already show. Getting that balance right across different kinds of holdings took a few weeks of daily use and revision.
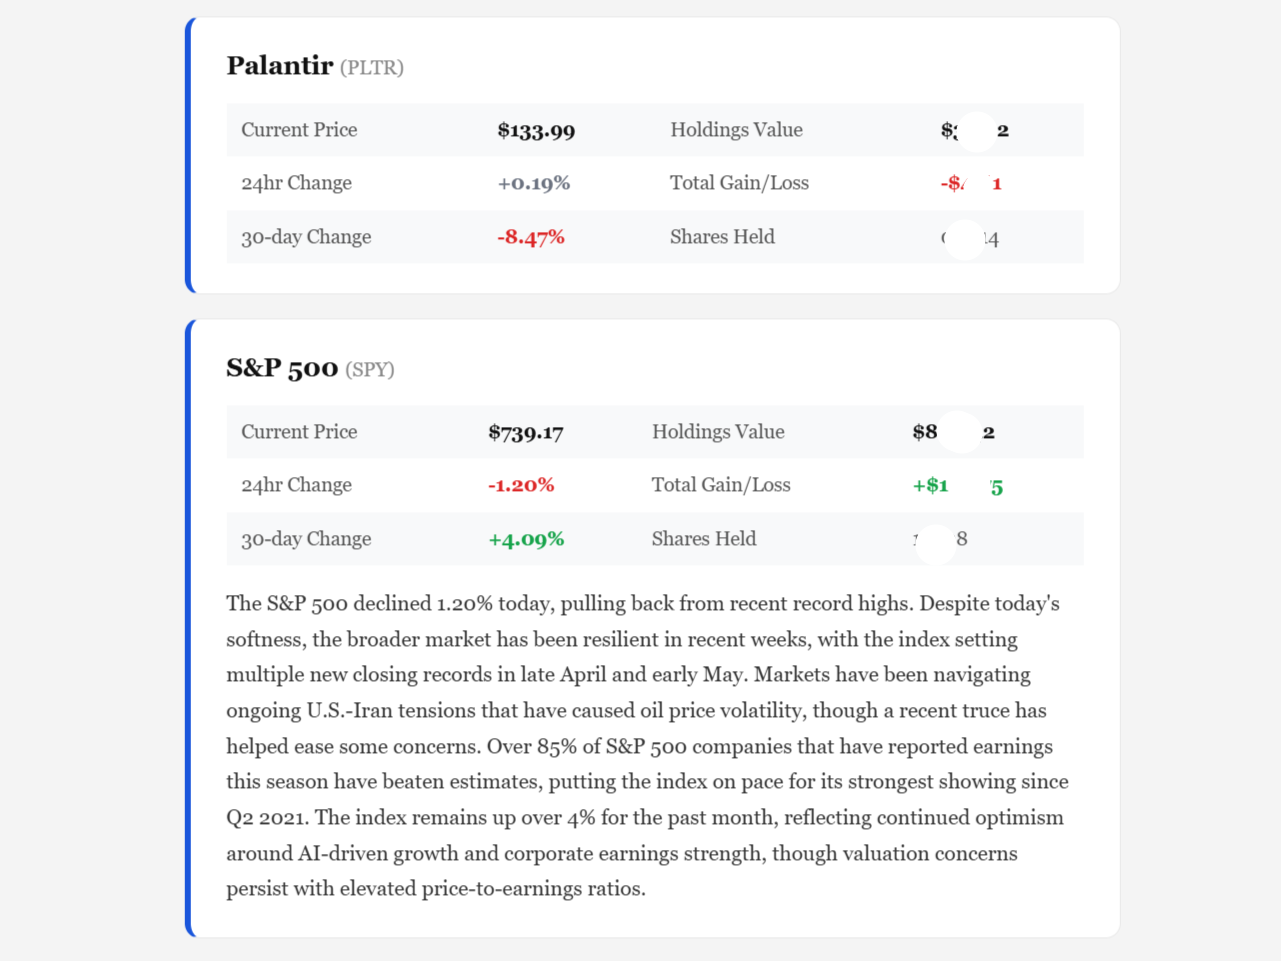 Two ticker sections from the report
Two problems from early in the build are worth noting. The initial design stored only company names in the sheet and used a GPT-4o mini call to classify each name to the correct ticker symbol. Misclassification came up often enough to be a real issue: names that matched multiple companies, or ones where the model's training data was inconsistent. The fix was to store the ticker directly in the sheet. The workflow is now fully deterministic from the input.
The other issue was currency. Some holdings are in stocks that trade in USD while others settled differently, and tracking live GBP/USD conversion rates introduced a second moving variable into the calculations that made the data harder to interpret cleanly. The decision was to work entirely in USD throughout the workflow, which simplified both the calculations and the agent's job when relating data back to portfolio context.
How It Gets Used
The "Want Report: No" flag covers a specific case: selling a position at a high but wanting to watch for a valuation drop as a potential re-entry point. The row stays in the sheet, the price still gets fetched and written back, but the holding does not appear in the evening report. Tracking without the noise.
The most concrete examples of the report adding real value have come from the more volatile holdings. TTWO (Take-Two Interactive) sees intermittent news and leak cycles that the Tavily search reliably picks up, particularly sentiment around GTA VI. Palantir is sensitive to US government actions and shifts in federal contracting priorities, and the report has surfaced relevant context on those movements on the days they have mattered. The period around the tariff announcements in April was the most active, when holdings were moving noticeably and the sentiment context helped distinguish moves driven by specific news from general market sell-offs.
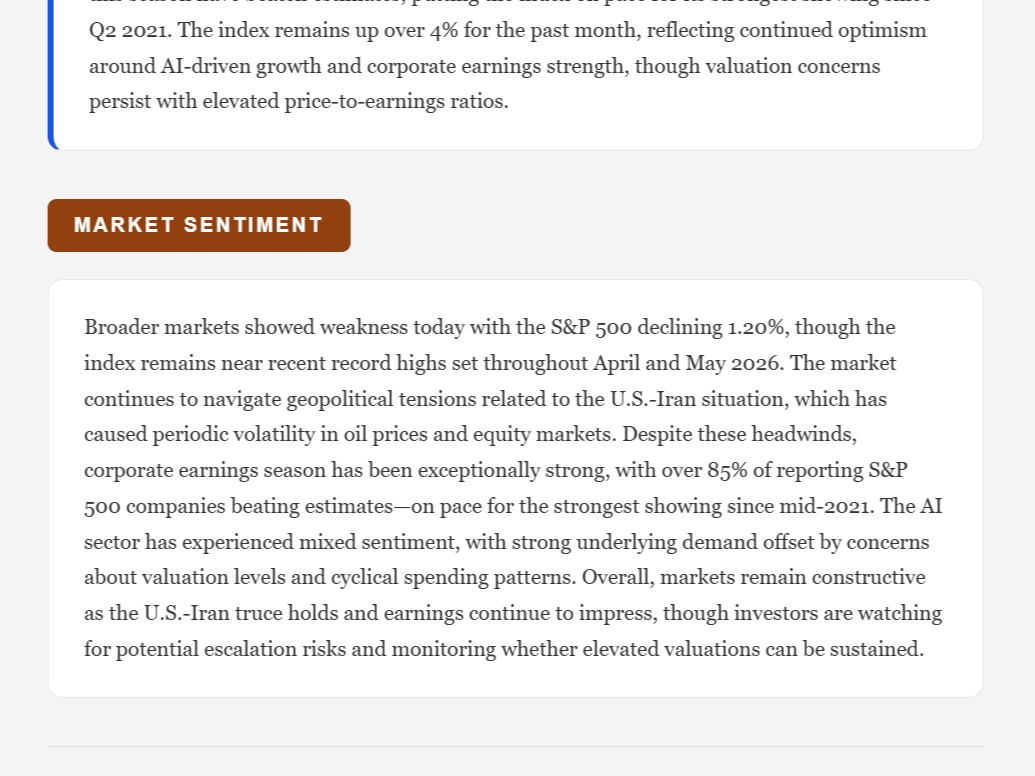 The market sentiment section
It runs at 21:30, after the US market closes, so the numbers are end-of-day rather than live. That timing is intentional: this is a summary, not a live monitor, and an evening delivery fits naturally with how I actually want to review this kind of information.
Still Running
This is one of two n8n workflows I continue to pay a subscription for, despite having shifted most of my building to Claude Code. The daily news sender is the other. Both run reliably and I have not had a good enough reason to move them.
More Projects

Study LLM: A RAG-Based Academic Knowledge Base
A multi-user platform that ingests university course materials and answers questions grounded in the uploaded content, with citations back to the source. Full backend complete, frontend in progress.

Researcher: A Chat-Based Technical Research Agent
An n8n chat agent that converts a research request into a structured technical document at three depth levels. Uses a two-stage pipeline with Tavily web search and arXiv academic paper access, delivered by email.